#areyoulistening: mining social media to collate people’s listening experiences

Simon Brown

Simon Brown is a Research Associate at the Royal College of Music working on the Listening Experience Database (LED) project, an Associate Lecturer with The Open University, and teaches Music Technology, Sound and Audio Theory at the Confetti Institute of Creative Technologies, which is part of Nottingham Trent University. He has recently submitted his PhD in Music at the Royal Birmingham Conservatoire on Benjamin Britten’s performance annotations in his Mozart scores.

Abstract

The advent of social media is one of the iconoclastic events in communication. The content is opinionated and often (apparently) trivial and imitative, and is therefore regarded by many as ephemeral. But where people might once have written a letter or kept a private diary to record their response to a piece of music, many are now turning to social media to share their thoughts and opinions about what they have experienced in a more immediate and open forum.

Different social media platforms offer different types of evidence. Whilst some enable the listener to engage and interact with the music more directly (such as YouTube and SoundCloud), other platforms allow the user simply to leave their own response or to engage in a discussion with other listeners (such as on Twitter, Facebook or a discussion forum), but there is a multitude of other data that is often connected to these responses. One of the challenges is to identify source data (for example, based on specific hashtags or surrounding an event) and to build a collection of that data for further analysis.

This chapter will address how we might develop a methodology for the mining and analysis of social media as primary source material for responses to music. It will consider the impact these various social media platforms might have on the way the listening experience is being captured.

Introduction

One of the objectives of the Listening Experience Database (LED) project is to develop a methodology for the mining and analysis of social media as primary source material for responses to music. The challenges are to identify source data (for example, based on specific hashtags, music or events) and to build a collection of that data from sources such as blogs, Twitter and other social media platforms for further analysis. Developing a methodology will offer a means of understanding what is potentially a rich primary source for people’s listening experiences.

Before considering how listening experiences might be captured via such platforms, it is worth considering the factors to be considered in approaching this type of source material. Due to the large volume of material available from any given platform, the first consideration is to define what, precisely, is to be examined in order to provide a manageable focus for the study. For instance, we might decide to investigate comments or online conversations surrounding an artist, performer or composer; alternatively, we might focus on the musical work such as a song, album, or a specific performance or recording; or we could choose to focus on a particular venue, location, event or topic. All of these will inevitably yield different results and there will often be overlaps between many of them, but any one of them offers a starting point, at least, for this large dataset.

The challenge here is to filter these accounts sufficiently to avoid large amounts of ‘noise’ or semantically poor results, and to focus the search on accounts of experiences that support the research questions or topics being addressed. In this chapter my research questions are twofold: firstly, how might we mine and subsequently analyse evidence of people’s responses to live music on social media platforms; and secondly, how useful is social media data as a primary source for listening experiences? There is an incongruity here, in the sense that on the one hand the material is ‘born-digital’, 1[1] According to the website of the National Archives (see <a href="http://www.nationalarchives.gov.uk/information-management/manage-information/digital-records-transfer/what-are-born-digital-records">http://www.nationalarchives.gov.uk/information-management/manage-information/digital-records-transfer/what-are-born-digital-records</a>, accessed 3 November 2018), ‘born-digital records are records that have been natively created in digital format (rather than digitised from paper records)’. Examples include email, Word or Google documents and any text that is created in an online environment, such as blogs, Tweets or Facebook posts. making it easier to mine and analyse (particularly in comparison with older texts that might need to undergo a digitisation process); but on the other hand, its quality as evidence might be questioned, as it is often ephemeral, imitative and therefore regarded by some as trivial.

Microblogging

For the purpose of this chapter, I will focus on microblogs. According to Kaplan and Haenlein (2011), a microblog is commonly understood as being typically smaller than a traditional blog (in terms of both content and file size), ‘allow[ing] users to exchange small elements of content such as short sentences, individual images, or video links’. 2[2] See Kaplan and Haenlein, 2011, p. 106 It is worth considering the elements of a microblog, and in this chapter I shall focus on two of the most commonly used platforms, Twitter and Facebook, because of the wealth of data that can be extracted from them. 3[3] It should be noted that Twitter currently allows its data to be interrogated through an API (Application Programming Interface) in a way that Facebook does not, thus making the extraction and manipulation of the data for further analysis much easier. But many of the elements that make up a Tweet are consistent across other social media platforms.

In any given Tweet there will be several elements, or what I shall refer to as dimensions, including: the text, a URL to external content, mentions of other Twitter users or accounts using the ‘@’ symbol, and hashtags that are often used to exemplify the emotion or sentiment being expressed or to alert other members of the Twitter community to a particular topic or item of interest. These dimensions that form the content of a Tweet can (and usually do) occur in any order.

In 2017, Twitter increased the number of characters that are permitted in each Tweet from 140 to 280. For the purpose of analysing listening experiences, we might assume that focusing on the textual evidence within a microblog would yield the most interesting results, and that longer microblogs might be more informative, as more text might provide more information, but this is not necessarily the case. According to Twitter CEO, Jack Dorsey, ‘the expanded tweet length hasn’t actually changed the length of messages people are sending out—but it has led to more engagement’. 4[4] See Kastrenakes, ‘Twitter says people are tweeting more, but not longer, with 280-character limit’ in <em>The Verge</em> [Online], <a href="https://www.theverge.com/2018/2/8/16990308/twitter-280-character-tweet-length">https://www.theverge.com/2018/2/8/16990308/twitter-280-character-tweet-length</a>, accessed 10 September 2018. By ‘engagement’, Dorsey is presumably referring to the fact that, during the pilot at least, people who were able to Tweet with the longer character count found they received more Likes, Retweets and @mentions, but also gained more followers and spent more time on Twitter. Twitter published further evidence of this in a series of blog posts. 5[5] See Rosen, ‘Tweeting Made Easier’, <em>Twitter.com</em> [Online], <a href="https://blog.twitter.com/official/en_us/topics/product/2017/tweetingmadeeasier.html">https://blog.twitter.com/official/en_us/topics/product/2017/tweetingmadeeasier.html</a>, accessed 10 September 2018. Furthermore, due to the still relatively tight restrictions on Twitter’s character count, there is an argument that Tweets tend to be highly relevant, with a focused use of language.

Social media posts are often rich in personal listening accounts, but some are more informative than others. So how might we differentiate between them? How might we deal with spam or uninformative microblogs, where a person writes a string of words such as ‘love love love’, for instance, which will have an impact on the analysis of term frequency? There is evidence that the order in which the dimensions (as described above) are presented in a microblog matters and is connected with the informativeness or relevance. 6[6] See Perez and Joemon, 2015, p. 214. Whilst not strictly relevant to this study, it is possible to map the order of these dimensions as they occur from the start to the end of the Tweet (for instance: (1) text, (2) mention(s), (3) URL(s) and (4) hashtag(s), or any combination of these dimensions). Examining the order of these dimensions can assist in finding more informative microblogs during searches or when filtering the live stream. There is also an issue about repetitiveness in Tweets, particularly where people Retweet one another’s posts, which can affect the results and often ceases to be informative.

There are several platforms available that allow the interaction with Twitter data, including online tools that capture or monitor the live stream, and both free and paid-for services are now commonplace. Depending on the requirements, many offer a similar feature, that is, the ability to capture large portions of data given a specific search criterion.

Methodology for the mining of social media data

The Chorus Software Suite was developed by Dr Timothy Cribbin at the Department of Computer Science, Brunel University, and Professor Julie Barnett and Dr Phillip Brooker at the Department of Psychology, University of Bath. 7[7] For a detailed explanation of the software suite’s functionality, see the documentation provided by the Chorus Project Team, <a href="http://chorusanalytics.co.uk/support/">http://chorusanalytics.co.uk/support</a>, accessed 10 September 2018.

Chorus Tweet-Catcher (Desktop Edition)

The Chorus package comprises two distinct programs. Firstly, Tweet-Catcher uses the Twitter API and allows users to mine the Twitter archive for relevant data in two distinct ways. According to Brooker, this can either be achieved by:

topical keywords appearing in Twitter conversations (i.e. semantically-driven data) or by identifying a network of Twitter users and following their daily ‘Twitter lives’ (i.e. user-driven data). 8[8] P. Brooker (2013) ‘Chorus: Twitter Data Capture and Visual Analytics for Social Science’, <em>Digital Methods as Mainstream Methodology</em> [Online], <a href="https://digitalmethodsnmi.wordpress.com/2013/04/11/chorus-twitter-data-capture-and-visual-analytics-for-social-science">https://digitalmethodsnmi.wordpress.com/2013/04/11/chorus-twitter-data-capture-and-visual-analytics-for-social-science</a><u>, </u>accessed 10 September 2018.

Depending on the search criteria, the results of this facility can provide large datasets that are rich in detail and include various metadata associated with either the Tweet or Twitter user.

Some of the metadata fields tend to be more populated than others (as highlighted in the User Manual by the Chorus Project Team, the GeoCordinates, for instance, are rarely disclosed by the Twitter user and are therefore usually blank, and the sentiment analysis score relies on the user of the software suite having Java installed, otherwise it will result in a score of zero). What is useful, for the purposes of collating and analysing listening experiences, is that it enables us to scale the dataset up or down. In other words, the software allows the user to ‘drill’ down into individual or small collections of microblogs over a very short time span, but also to see how these fit within the wider context of relevant Twitter conversations that surround them.

Chorus-TV (TweetVis)

The second component of the Chorus Suite is Chorus-TV (or TweetVis).

figure 1
Figure 1: Chorus-TV (TweetVis) displaying 2,545 Tweets between 20 February 2018 and 2 March 2018 that mention the string ‘paulwellerHQ’, which is a visual analytic suite for facilitating both quantitative and qualitative approaches to social media data.

As Brooker suggests, the visual analytics approach is highly relevant to our aims, ‘enabling exploratory analysis of social media data in an intuitive and user-friendly fashion’. 9[9] P. Brooker (2013) ‘Chorus: Twitter Data Capture and Visual Analytics for Social Science’, <em>Digital Methods as Mainstream Methodology</em> [Online], <a href="https://digitalmethodsnmi.wordpress.com/2013/04/11/chorus-twitter-data-capture-and-visual-analytics-for-social-science/">https://digitalmethodsnmi.wordpress.com/2013/04/11/chorus-twitter-data-capture-and-visual-analytics-for-social-science/</a><u>, </u>accessed 10 September 2018. The results of the mining process feed back in to the methodology in an iterative way, allowing the user to explore what the data reveals, rather than approaching it with a specific research question in mind.

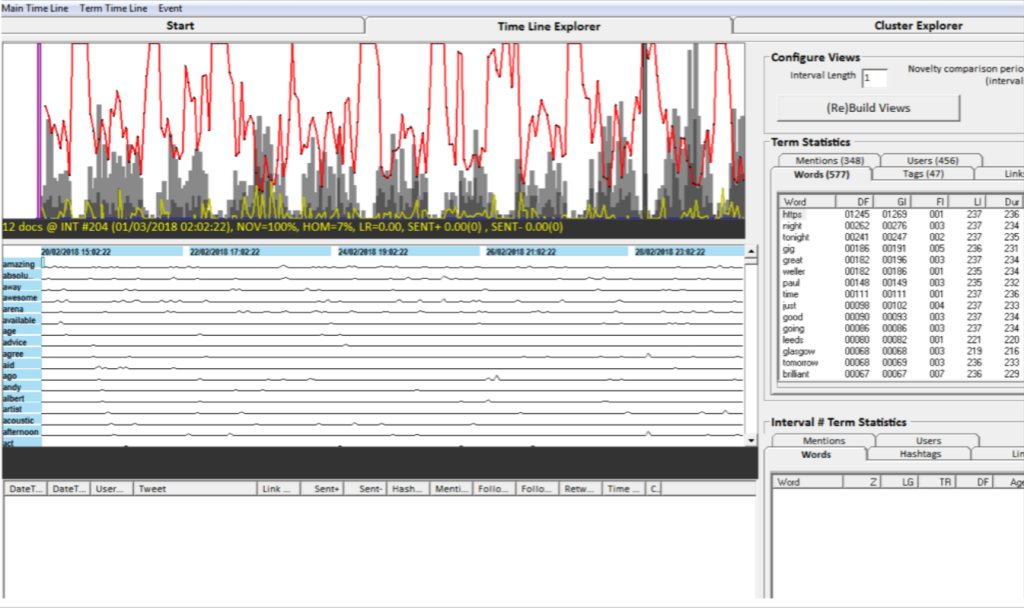
It is not necessary to go into a detailed explanation of what each facility of the software does 10[10] As mentioned above, interested readers might consult the online documentation available at: <a href="http://chorusanalytics.co.uk/support">http://chorusanalytics.co.uk/support</a>. but the Time-Line view essentially provides the high-level narrative of Twitter activity over the course of the study period. With reference to the figure above, the features that are of most interest here are as follows:

  • The two grey bar-charts detail the tweet count (light grey) and tweet-with-link (URL) count (dark grey) for each interval.
  • Each of the grey bars represents an hour’s worth of Twitter activity for the search term.
  • Each interval (column) can be thought of as a ‘super-tweet’ wherein the value of each cell represents the proportion of tweets in that interval containing that term.
  • The red and yellow line graphs represent novelty and homogeneity measures respectively, showing shifts in topic over time. Hence, each point on the red line is a measure of the dissimilarity in word frequency profile between that interval and other surrounding intervals. Similarly, each point on the yellow line is a measure of the similarity in word frequency profile between that interval and other surrounding intervals. 11[11] For reasons of both clarity and accuracy the following are taken verbatim from the Chorus TweetVis User Manual, <a href="http://chorusanalytics.co.uk/manuals/Chorus-TV_usermanual.pdf">http://chorusanalytics.co.uk/manuals/Chorus-TV_usermanual.pdf</a>, accessed 10 September 2018.

The Term Statistics window on the right-hand side lists various term frequencies such as words, hashtags and usernames amongst others:

  • DF refers to Document Frequency, or the number of Tweets in which the term appears.
  • GI refers to Global Incidence, or the total number of times the term appears within the dataset.
  • FI refers to First Interval, or the first interval in which the term appears.
  • LI refers to Last Interval, or the last interval in which the term appears.
  • Dur refers to Duration, or the difference between the first and last intervals in which the term appears.

Using the Chorus software to capture a dataset, which is focused on a Twitter username or hashtag (or both), the Time-Line view and Term Statistics window assist in the exploration of what the dataset reveals. This can include analysis of how the Twitter activity evolves over time, and/or word frequency and term statistics as outlined above. For the purpose of this chapter, the software enabled the study of how listeners responded on Twitter to a series of live performances by a well-established musician.

Case-study: paulwellerHQ

In order to demonstrate the application of the Chorus software, I shall use the English singer/songwriter and musician, Paul Weller (b. 1958), who first came to prominence with the punk rock/mod revival band, The Jam, between 1976 and 1982 and The Style Council between 1983 and 1989, before establishing his solo career in 1991. The reasons for this are twofold. Firstly, Weller is an international artist with a fan-base of over 145,000 followers on Twitter and over 467,000 Likes on Facebook. This affords the opportunity to work with different scales of data should we wish, from the individual microblog to larger datasets of word lists using n-grams, and so on; but, also, it allows us to examine a sample of online primary source material for responses to the music of a specific musician, during a live event at a specific venue, across a short time frame. By the beginning of 2018, Weller was coming to the end of an extensive world tour that took in Australia, Japan, Canada and the United States, Europe and many cities throughout the UK. In order to provide a more detailed analysis of the evidence I shall focus on the last leg of this tour, with his performances in Leeds, Newcastle-Upon-Tyne, Glasgow, and Nottingham in particular.

Firstly, as a point of comparison to the social media data that I shall later refer to, it is useful to consider the only published review of the concert on 27 February 2018, from the Nottingham Evening Post. It discusses Weller’s history, the set list, his persona on stage and some audience reaction, but overall it is not particularly enthusiastic:

As arena shows go, the roof remains on. But Weller holds attention throughout. Seldom addressing the crowd, he speaks most when signing-off to thank them for listening and for supporting him and his music for the past 40 years. 12[12] See A. Afford (2018) ‘Paul Weller is ‘interesting but not for everyone’ at Nottingham’s Motorpoint Arena – review and photos’, <em>Nottingham Evening Post</em> [Online], <a href="https://www.nottinghampost.com/whats-on/music-nightlife/paul-weller-interesting-not-everyone-1274359#comments-section">https://www.nottinghampost.com/whats-on/music-nightlife/paul-weller-interesting-not-everyone-1274359#comments-section</a>, accessed 10 September 2018.

It concludes that:

His career is actually more of an art installation. And he’s in his ‘unmade bed’ phase. By definition it’s not for everyone. But it remains interesting. Different to the point of challenging. And more than anything; king-sized. 13[13] See A. Afford (2018) ‘Paul Weller is ‘interesting but not for everyone’ at Nottingham’s Motorpoint Arena – review and photos’, <em>Nottingham Evening Post</em> [Online], <a href="https://www.nottinghampost.com/whats-on/music-nightlife/paul-weller-interesting-not-everyone-1274359#comments-section">https://www.nottinghampost.com/whats-on/music-nightlife/paul-weller-interesting-not-everyone-1274359#comments-section</a>, accessed 10 September 2018.

There are two reactions to this article in the comments section of the Evening Post website. The first reads:

Average at best shud [sic] stick to smaller venues to create a better atmosphere. Unlike noel gallagher who’s plying [sic] there soon who really blows the roof off. can’t wait. [sic] 14[14] See lindsey806 (2018) ‘Comments’ in Andy Afford’s ‘Paul Weller is ‘interesting but not for everyone’ at Nottingham’s Motorpoint Arena – review and photos’, <em>Nottingham Evening Post</em> [Online], <a href="https://www.nottinghampost.com/whats-on/music-nightlife/paul-weller-interesting-not-everyone-1274359#comments-section">https://www.nottinghampost.com/whats-on/music-nightlife/paul-weller-interesting-not-everyone-1274359#comments-section</a>, accessed 10 September 2018.

The mention of Noel Gallagher (the singer/songwriter from the band Oasis) is interesting as the comment comes a day after an increase in Twitter conversations following an attack on Weller by Noel’s brother, Liam Gallagher, as reported in the Evening Standard. 15[15] See E. Powell (2018) ‘What a k***’: Liam Gallagher slated by Paul Weller fans after scathing Twitter tirade’ in <em>Evening Standard</em> [Online], <a href="https://www.standard.co.uk/showbiz/celebrity-news/what-a-k-liam-gallagher-slated-by-paul-weller-fans-after-scathingtwitter-tirade-a3778886.html">https://www.standard.co.uk/showbiz/celebrity-news/what-a-k-liam-gallagher-slated-by-paul-weller-fans-after-scathingtwitter-tirade-a3778886.html</a>, accessed 10 September 2018.

The controversy, amongst some of Weller’s Twitter fans at least, was that he would be supporting Noel Gallagher at the 2018 Downs Festival in Bristol. Weller fans took to Twitter to express their anger at Noel Gallagher being given the headline slot. In fact, the relationship between Weller and Noel Gallagher, as documented in a recent interview with NME, 16[16] See A. Trendell (2018) ‘Paul Weller on why he’s such a huge fan of Noel Gallagher’ in <em>NME</em> [Online], <a href="https://www.nme.com/news/music/paul-weller-hes-huge-fan-noel-gallagher-2250288">https://www.nme.com/news/music/paul-weller-hes-huge-fan-noel-gallagher-2250288</a>, accessed 10 September 2018. is one of mutual admiration and ongoing collaboration.

The second comment on the Evening Post article is more favourable:

Weller was on top form, problem is too many turn up just wanting to hear Jam songs and not interested in what Weller is doing at present. Go see Foxton if its Jam songs only you want to hear. For me after first seeing Weller in 83, last night was him sounding better than he ever has. 17[17] See Jimbob1969 (2018) ‘Comments’ in Andy Afford’s ‘Paul Weller is ‘interesting but not for everyone’ at Nottingham’s Motorpoint Arena – review and photos’, <em>Nottingham Evening Post </em>[Online], <a href="https://www.nottinghampost.com/whats-on/music-nightlife/paul-weller-interesting-not-everyone-1274359#comments-section">https://www.nottinghampost.com/whats-on/music-nightlife/paul-weller-interesting-not-everyone-1274359#comments-section</a>, accessed 10 September 2018.

The mention of ‘Foxton’ relates to the bassist, Bruce Foxton, of The Jam, and it implies that there may have been a sense of negativity amongst some members of the audience wanting to hear more of Weller’s repertoire from his earlier years with The Jam. Further evidence of this will be found in the audience’s testimony.

Twitter data/comments

Using the Chorus software, a search was performed for Tweets from 20 February to 2 March 2018 that mention ‘paulwellerHQ’. This captured both the hashtag ‘#paulwellerHQ’ and Weller’s official Twitter account, ‘@paulwellerHQ’. This date range enables us to view the Twitter conversation during the days before and after this leg of the tour. It is interesting to capture listening experiences during the concert and to compare these in the days immediately before and after the event, so that we can understand how the content of the Tweets evolves. The search returned 4,705 results. This might sound like a substantial dataset but having removed the Retweets (2,160), which rarely contain anything of additional value in terms of listening experiences, it resulted in a dataset of 2,545 tweets. Of course, many of these were not related to the live concerts within the UK but were part of a wider community of Twitter users discussing Weller in more general terms. Returning briefly to the Term Statistics window in the figure above, it is apparent that some of the highest word frequencies amongst the dataset at a specific time include Weller’s name (as expected), the cities where he is currently performing, as well as adjectives such as ‘great’, ‘good’ and ‘brilliant’. The Term Statistics window also enables the data to be sorted by frequency of mentions, users, hashtags or links (URLs).

The concert at Nottingham Arena began at 19:30 with support by The Strypes and there is evidence that people took to Twitter to share the fact that they were at the event; we can see several comments where people were ‘waiting for the main man’ or ‘perfect Tuesday evening. [Nottingham] Motorpoint [Arena] to see @paulwellerHQ’. Others address their message directly to Weller, for example, ‘On our way to see you later. [sic] Also really looking forward to seeing @TheStrypes again too! Top night in prospect’.

From approximately 20:00 to 21:00 (during the start of Weller’s performance), there are no Tweets that relate specifically to the concert, with the frequency increasing as the night proceeds. This raises the question as to whether this is normal behaviour at a concert; as the artist begins their set, are people more inclined to focus on the performance (ignoring their smartphones), but turn their focus to recording their experience (or at the very least, sharing the fact that they are there, witnessing it live) as the gig progresses?

There is evidence of this if we look at the next interval of data from 21:00 to 22:00. At 21:15 there is the first recorded reaction, which simply reads ‘great show with @paulwellerHQ’ and the next at 21:41 reads ‘Paul’s on fire tonight, brilliant night in Nottingham’. But at 21:50 there is a noticeable change in the style of Tweets as people begin to include other hashtags or images. For instance, one listener writes ‘An evening with Paul Weller @chris[…] @paulwellerHQ @nottinghamarena #WellerLive’ and includes a photo of the tour programme. From the Twitter usernames, it is apparent that the listener is tagging their relative but also Weller’s Twitter account (despite the fact they have already mentioned him by name in the text). By including Weller’s Twitter username and the hashtag ‘#WellerLive’, which the artist often uses himself when discussing live shows over Twitter, they are both reaching out to the artist (presumably in the hope that Weller will at least see their response at some stage, or perhaps even respond directly to them, which incidentally, he is known to do quite frequently) but also highlighting to the rest of the Twitter community that they are in attendance. They also include the ‘@nottinghamarena’ Twitter account as a means to highlight where they are at that particular time, but also (presumably) to widen their reach to other followers or to the arena itself, which is likely to have many more followers than the individual currently has (at the time of writing, in March 2018, the listener has just 20 followers as opposed to the Arena’s 106,000).

As the concert draws to a close, there are a few more Tweets, such as at 22:29: ‘Awesome!! Nothing else to say!! @paulwellerHQ @BENGORDELIER Nottingham rocked!!! Thank you!!’, which includes a photo of the performers. Ben Gordelier is Weller’s drummer on the tour, and the fact that listeners can have this level of connectivity beyond Weller himself, with individual performers within the band is further testament to the immediacy (and, arguably, part of the attraction) of Twitter. Before the advent of social media, listeners at such events have rarely had this level of connectivity with the performers. Likewise, performers have rarely been in a position to receive such immediate and raw feedback on such a large scale.

Weller ends the concert with one of his best known hits from The Jam era, which is acknowledged in a Tweet at [22:53] ‘Town called Malice @paulwellerHQ @nottinghamarena #Class’ along with a video of the performance taken on their phone. The remaining Tweets from that evening all share the same positive sentiment and there is an increase in activity as people continue to record their experience immediately after the concert, including:

[23:09] @paulwellerHQ on top form in Notts. English Rose was my pick.

[23:21] What an amazing night watching the @paulwellerHQ band – got a wonderful programme with shit hot photographs and husband done some filming – thankyou very much

[23:30] Great night at @paulwellerHQ with the wifey

[23:50] Words cannot describe the performance by @paulwellerHQ at the @nottinghamarena tonight but phenomenal comes close! What a night! #PaulWeller #Notts #gigs #livemusic #singersongwriter

[23:54] Weller tonight in Nottingham #Legend @paulwellerHQ @HannahKCWeller [Hannah Weller is the musician’s wife]

[23:55] @paulwellerHQ just got home from Paul Weller Notts gig me and my son loved it thank you

What is striking about these is just how consistent the positive sentiment is. In comparison to the review from the Nottingham Evening Post critic (and the subsequent comment left by the Noel Gallagher fan, who is not entirely explicit as to whether they even attended the concert themselves or whether they are just offering their opinion), there is evidence that some of the audience appear to prefer Weller’s older (and therefore, presumably, more familiar) material. This is apparent from the mention of some of Weller’s more popular songs throughout the Tweets. But there does not appear to be any negative sentiment being expressed via these Tweets that replicate the critic’s suggestion that the ‘roof remain[ed] on’. 18[18] See A. Afford (2018) ‘Paul Weller is ‘interesting but not for everyone’ at Nottingham’s Motorpoint Arena – review and photos’, <em>Nottingham Evening Post</em> [Online], <a href="https://www.nottinghampost.com/whats-on/music-nightlife/paul-weller-interesting-not-everyone-1274359#comments-section">https://www.nottinghampost.com/whats-on/music-nightlife/paul-weller-interesting-not-everyone-1274359#comments-section</a>, accessed 10 September 2018. Of course, these listening accounts might simply be evidence of a captive audience of Weller fans who were bound to be positive. But it might also suggest evidence that the professional critic’s view is not necessarily the same as the fan/listener experience.

Of further interest is the behavioural pattern that emerged from the Nottingham concert, which is replicated across the other three dates in Leeds, Newcastle-Upon-Tyne and Glasgow. The Twitter conversations begin with the anticipation of the show (as we might expect), but are then followed by silence (or very little Twitter activity) during the start of the performance, followed by an increase in Tweets and an expansion of the hashtags, usernames, posted photos and videos that are included in the Tweets. This trend continues into the next day although the inclusion of hashtags and relevant mentions of geographic Twitter accounts (such as @nottinghamarena) tends to trail off, which potentially highlights the importance of the time-sensitive content within the medium that people are using. Indeed, one of the attractions of posting a Tweet is that it allows users to divulge where they are at any given time (as reflected by the inclusion of geographic accounts or particular events with the use of a hashtag). In other words, it enables listeners to demonstrate the immediacy of their connection with the music – it is a way of declaring that they are actually there, listening to it live. But as time passes, the inclusion of such geographic accounts and hashtags is seemingly less relevant to users and is therefore often omitted. So how does this compare with experiences recorded on Facebook?

Facebook data/comments

One of the issues with collating microblogs of listening experiences from Facebook is that users can restrict who can see their posts. Depending on their privacy settings, this often means that only the people that they are connected with can see what they have posted. Therefore we should be cautious about drawing any firm conclusions from the data as we might only be relying on a small subset rather than the whole picture. That said, there are similarities to what was observed on Twitter in terms of the type of evidence being recorded throughout the different stages of the event.

As with Twitter, there are the usual posts before the performance written in anticipation of the event, where people are posting status updates describing how they are waiting for Weller to appear, or showing that they are at the concert by tagging the venue in their post. With regards to the Nottingham date, of the 33 posts that were visible, only five were posted during the concert, the majority (eighteen) were posted prior to the event, either late in the afternoon or immediately before (many mentioning having a meal or drinks prior to attending the concert), ten were posted either immediately after the gig had ended or the following day, and some of the discussions continued over the ensuing couple of days.

The five comments recorded on Facebook whilst the Nottingham concert took place offer little in terms of textual evidence. The first was posted at 20:34 and is a photograph of Weller and his band taken from within the crowd, accompanied by the brief statement ‘The arena Sir Paul Weller’ and the listener had tagged Weller in their post.

At 20:50 one listener is ‘feeling fabulous at Motorpoint Arena’ and states:

Here again this time for the legend that is Paul Weller xxx amazeballs.

As we saw with Twitter, the listener has tagged the venue here (commonly known as a ‘check-in’ on Facebook, as this records the user’s history of places they have frequented), which is further evidence of listeners demonstrating the immediacy of their connection with the music by acknowledging they were there. This is followed by another listener’s post at 20:52, observing ‘Motorpoint arena packed for paul weller’ (and again, the artist has been tagged). The next post tells us more about the listener’s levels of intoxication, rather than their listening experience. At 21:04 they write:

Me, kitchen Dave and Paul Weller [tagged] getting pissed!

In this post, the listener has chosen to comment on the Facebook event, which already has Weller and the venue tagged, but the listener has subsequently tagged Weller a second time within their text. And the final post at 21:42 is another photograph/selfie with their partner (presumably), and they simply tag Weller in it.

The comments that follow, after the concert has ended, appear to provide slightly more detail as people engage in more of a conversation. One listener writes immediately after the concert:

Well…Paul Weller [tagged] was epic!!

Once in a lifetime experience. Bloody smashed it lad

In response, one of his ‘friends’ comments the day after:

He’s hit n miss [sic] I think, sometimes he’s class and sometimes he looks like he can’t be arsed!

The original listener responds:

He was on it the other night though, you missed a good set mate. The new stuff not that fussed with but the classics.

This listener finishes their comment with the ‘OK Hand’ emoji.

And finally, posted the morning after the gig, another listener writes:

Blown away by Paul Weller [tagged] and his amazing musicians fabulous concert real talent

In response to someone’s comment that:

You are never disappointed with a Weller concert hope he played some of your faves x

the original listener replies:

He did Graham but the whole concert was fantastic

As before, this listener relies on emojis to express their experience.

It is apparent that these conversations appear to be about expressing emotion and how the music made the listeners feel (hence their reliance on using emojis). They are not talking about the music in itself. Perhaps we could even venture to say that these people might lack the musical language to do that. But it is absolutely about the experience they have had and central to that is the sense that social media allows them to create a community of people around and including Weller himself, who they feel able to refer to familiarly as ‘lad’, as well as referring to each other as ‘mate’ and by first name (Graham) (even though they may never have met each other). It is a useful illustration of ‘ordinary listeners’ articulating their responses and validating each others’ responses in the process.

Conclusion

So what do these accounts of listening experiences from Twitter and Facebook reveal? The fact that some people shared their experience by posting on social media is evidence that the occasion was significant to them, or at least had some impact on them (whether the sentiment was positive or negative). It is difficult to say at this stage, without further analysis across a larger dataset, whether the textual evidence posted to Facebook is sufficient to provide us with any meaningful insights into the listening experiences; other than the listener during the Nottingham concert who described themselves as ‘feeling fabulous’, and the conversations that followed immediately after the concert and into the next day, they are all, perhaps surprisingly, even more succinct than many of the Twitter posts. But this does provide some circumstantial evidence that Tweets tend to be a relevant source, with a more focused use of language. There appeared to be a more consistent use of the dimensions within a Tweet than those found on Facebook; in addition to a more succinct usage of text, listeners would be more consistent in incorporating user names (@mentions), hashtags, URLs, photos and videos. It also reveals a couple of other characteristics of Facebook users: firstly, all of the listeners seem to be content with simply stating that they are attending the concert; and secondly, every listener (at this concert, at least) ensures they tag Weller’s Facebook page in their posts.

There is some evidence on both Twitter and Facebook that listeners wanted to hear more of Weller’s hits from The Jam era. Some would simply Tweet song titles to Weller’s account, which is curious – do they believe he might be checking his phone/Twitter account during the concert, or is it merely a means to provide the artist with feedback with the hope of influencing future performances? This was not replicated on Facebook but there is an underlying sentiment from at least a couple of listeners that they were keen to hear the ‘classics’ as opposed to Weller’s more recent material.

It proved much easier to capture this evidence from Twitter than Facebook. This is partly due to the restrictions enforced by Facebook that prevent the interrogation of their data without paying for the privilege, but also because the content of Facebook posts is not made readily available to the same extent as is currently the case with Twitter. Facebook users can also restrict their accounts via their security settings, which means that search results are often affected, as not all comments are visible. It is highly likely that more experiences were posted via Facebook than were visible to this study simply because users restricted their accounts so that only their network of ‘friends’ could see their posts. The fact that Twitter currently allows anyone to mine and subsequently analyse their data via an API means that it is a useful primary source for gathering people’s listening experiences. The Chorus Software Suite proved invaluable for this purpose. The functionality of the software means that further analysis is also possible on either term or word frequency. It enables the user to track how the Twitter conversation evolves over time, either by user or topic. The most useful features for the purpose of this study were: the ability to extract all of the Tweets that used a specific username or hashtag (in the first instance); the subsequent ordering of this data by date and time; and the ability to focus on small segments of the data in order to extract them and to compare them with the wider Twitter conversation. As stated, there are other tools available (both free and paid-for services) for this type of endeavour.

It would also be useful to compare the type of evidence captured on Facebook and Twitter with other social media platforms. For instance, YouTube affords users the ability to comment on videos of specific performances (and both published and unpublished versions of songs and/or concerts). This might allow for a more thorough investigation as the performance itself can be analysed to see how these comments compare to each other, as well as to any published reviews and the analyst’s own interpretation. Similarly, SoundCloud enables its users to leave a comment on precise points within a track that has been uploaded to their platform. This gives users the potential ability to leave more precise feedback (although a preliminary study has revealed that many of these comments are very short – usually just a couple of words – and therefore might be of limited use). Nevertheless, different social media platforms offer different perspectives on how listeners record their experiences.

Of course, this was just one small group of listeners that appeared to consist of mainly longstanding (and therefore presumably loyal) fans of Weller. Therefore, it is only representative of what is probably a similar demographic of people, whose usage of social media is likely to be quite different to that of other Twitter users (for instance, much younger generations with differing musical tastes). Therefore it would be interesting to see how these results compare across other Twitter users and different genres of music. The fact that the behaviour of Twitter users appears to be consistent across each of the four concerts in Leeds, Newcastle-Upon-Tyne, Glasgow and Nottingham was of most significance. People followed a similar pattern of sharing their excitement in anticipation of the concert, followed by little to no activity on Twitter during the start of the concert, followed by an increase in Twitter activity and an expansion of the dimensions that continued the following day, albeit with a reduction in geographic or time-specific dimensions (such as including the event or venue). The reduction in posts being curated during the start of the concert was not replicated on Facebook, although the other behavioural patterns were. At the most simplistic level, this behaviour might suggest that listeners are most engaged with the performance during the start of the concert, with attention levels waning as time progresses, as evidenced by their decision to use their smartphones. Of course, this is not necessarily indicative of a negative response (indeed the evidence provided here suggests otherwise) but merely that listeners wish to record, capture and/or share their experience as the performance proceeds.

The fact that the content of microblogs can be opinionated and often (apparently) trivial and imitative, and is therefore regarded by many as ephemeral can be a reason why we might be reluctant to draw on it as a primary source material. However, if we look beyond the sentiment being expressed and use this in parallel with other forms of knowledge that can be extracted from the data, it can reveal useful insights into people’s behaviours and the way they record their listening experiences.

Select bibliography

Afford, A. ‘Paul Weller is ‘interesting but not for everyone’ at Nottingham’s Motorpoint Arena – review and photos’, Nottingham Evening Post [Online], 2018, https://www.nottinghampost.com/whats-on/music-nightlife/paul-weller-interesting-not-everyone-1274359#comments-section, accessed 10 September 2018.

Brooker, P. ‘Chorus: Twitter Data Capture and Visual Analytics for Social Science’, Digital Methods as Mainstream Methodology [Online], 2013, https://digitalmethodsnmi.wordpress.com/2013/04/11/chorus-twitter-data-capture-and-visual-analytics-for-social-science, accessed 10 September 2018.

Brooker, P. ‘User Manuals’, The Chorus Project [Online], 2013, http://chorusanalytics.co.uk/support, accessed 10 September 2018.

Jimbob1969. ‘Comments’ in Andy Afford’s ‘Paul Weller is ‘interesting but not for everyone’ at Nottingham’s Motorpoint Arena – review and photos’, Nottingham Evening Post [Online], 2018, https://www.nottinghampost.com/whats-on/music-nightlife/paul-weller-interesting-not-everyone-1274359#comments-section, accessed 10 September 2018.

Kastrenakes, J. ‘Twitter says people are tweeting more, but not longer, with 280-character limit’ in The Verge [Online], 2018, https://www.theverge.com/2018/2/8/16990308/twitter-280-character-tweet-length, accessed 10 September 2018.

lindsey806. ‘Comments’ in Andy Afford’s ‘Paul Weller is ‘interesting but not for everyone’ at Nottingham’s Motorpoint Arena – review and photos’, Nottingham Evening Post [Online], 2018, https://www.nottinghampost.com/whats-on/music-nightlife/paul-weller-interesting-not-everyone-1274359#comments-section, accessed 10 September 2018.

Perez, J. A. R. and Joemon, M. J. ‘On Microblog Dimensionality and Informativeness: Exploiting Microblogs’ Structure and Dimensions for Ad-Hoc Retrieval’ in Proceedings of the 2015 International Conference on The Theory of Information Retrieval, 2015, DOI: doi>10.1145/2808194.2809466 pp. 211-220, accessed 10 September 2018.

Powell, E. ‘What a k***’: Liam Gallagher slated by Paul Weller fans after scathing Twitter tirade’ in Evening Standard [Online], 2018, https://www.standard.co.uk/showbiz/celebrity-news/what-a-k-liam-gallagher-slated-by-paul-weller-fans-after-scathingtwitter-tirade-a3778886.html, accessed 10 September 2018.

Rosen, A. ‘Tweeting Made Easier’, Twitter.com [Online], 2017, https://blog.twitter.com/official/en_us/topics/product/2017/tweetingmadeeasier.html, accessed 10 September 2018.

The National Archives. Born-digital records and metadata [Online], 2018, http://www.nationalarchives.gov.uk/information-management/manage-information/digital-records-transfer/what-are-born-digital-records, accessed 3 November 2018.

Trendell, A. ‘Paul Weller on why he’s such a huge fan of Noel Gallagher’ in NME [Online], 2018, https://www.nme.com/news/music/paul-weller-hes-huge-fan-noel-gallagher-2250288, accessed 10 September 2018.

Please leave a comment or share via social media by clicking on the icons.

View the online publication details 19[19] <em>The Experience of Listening to Music: Methodologies, Identities, Histories</em> has been Open Access funded by the Arts & Humanities Research Council (AHRC), grant AH/J013986/1, https://ledbooks.org/proceedings2019 The collection has been peer reviewed, edited by David Rowland and Helen Barlow, and subsequently prepared for online publication by the Knowledge Media Institute (KMi) of The Open University. Published by: The Open University, Walton Hall, Milton Keynes MK7 6AA.  Copyright © The Open University. First published: July 2019. ISBN: 9781473028647. PDFs displaying some of the content from the online collection are available from <a href="https://ledbooks.org/proceedings2019/getting-the-best-from-this-website/">https://ledbooks.org/proceedings2019/getting-the-best-from-this-website/</a> You can experience the online publication as it was originally designed at <a href="https://ledbooks.org/proceedings2019">https://ledbooks.org/proceedings2019</a> View copyright information relating to the publication here: <a href="https://ledbooks.org/proceedings2019/copyright">https://ledbooks.org/proceedings2019/copyright</a>


Download: #areyoulistening: mining social media to collate people’s listening experiences

The Harkive Project: popular music reception, digital technologies, and data analysis

Craig Hamilton

Craig Hamilton is a Research Fellow in the School of Media at Birmingham City University. His research explores contemporary popular music reception practices and the role of digital, data, and internet technologies on the business and cultural environments of music consumption. This research is built around the development of The Harkive Project, an online, crowd-sourced method of generating data from music consumers about their everyday relationships with music and technology. Craig is also the Co-Managing Editor of Riffs: Experimental Research on Popular Music.

Abstract

Through an analysis of how respondents to The Harkive Project describe their use of vinyl records, this article will demonstrate and reflect upon the development of an experimental methodological approach derived from the fields of digital humanities and cultural analytics, and show how this was applied to my ‘home’ discipline of popular music studies. Before proceeding to my analysis, I first describe the context and rationale for taking this approach. In reflecting on this approach I discuss how it enabled me to explore how data-derived knowledge creation works through practice within contemporary popular music culture, highlighting some of the issues raised by data-related technologies and techniques in both popular music culture and in arts and humanities research. My hope is that work in this area may help popular music studies begin to account for the technologies and practices that have so changed the field. Towards that aim, and in consideration of Sandvig and Hargittai’s recent work highlighting the importance of ‘benchwork’, my article links to code, sample data, and instructional blog posts that may enable scholars to replicate and/or build upon my work.

Introduction

This paper was delivered at the 2018 Listening Experience Database (LED) project conference at The Open University, Milton Keynes, on 7 March 2018. The conference took place just a few days after I completed my PhD at Birmingham City University and was in fact my first outing as a newly minted doctor. I am delighted, then, to have been invited to revisit that talk for this volume of LED proceedings.

During my AHRC-Midland3Cities-funded research project I looked at popular music reception, with a particular focus on the digital, data, and internet technologies that have over the last 20 years helped bring about such huge changes in my field of study. In this article I want to provide an overview of my research, and in particular describe how working through a number of methodological issues ultimately led me towards ideas and practices that may be more broadly understood as ‘data science’. Ultimately, and just as I did in my thesis, I want to argue that a greater practical understanding of and critical engagement with the digital, data, and internet technologies is possible, both for popular music scholars such as myself, and also for the millions of people who engage with popular music in their everyday lives. Along the way I hope to demonstrate that my work represents a small step towards that.

After briefly describing Harkive, the project that underpinned my research, I will demonstrate how I arrived at using automated data collection and computational analysis techniques in my work. By walking through an example of the type of analysis I undertook, I want to highlight some of the potential benefits and problems with such an approach. I will then reflect on some of those potential benefits and problems, and suggest some next steps. My hope is that the work undertaken during my project may provide a springboard for future work, and in particular for the creation of new tools, platforms, and research projects that may enable consumers and scholars alike to develop useful and productive epistemic responses to the role of digital, data, and internet technologies in popular music. To begin, however, I should briefly explain what The Harkive Project is.

The Harkive Project

Harkive is an online, crowd-sourced project that runs on a single day in July of each year. It invites people to provide detail and reflection on their experiences with music across the course of a single day. Since the project first ran in 2013 it has gathered over 10,000 individual entries. The reflections and detail contained within the Harkive dataset come from posts made to social media platforms, from participants who have emailed the project directly, or from people who have completed an online form. The shortest entry in the database contains only two words, the longest almost 4,000.

Taken as a whole the Harkive dataset contains descriptions and reflections on many different forms of music reception. By music reception, I am taking Keith Negus’ definition of ‘how people receive, interpret and use music as a cultural form while engaging in specific social activities.’ 20[20] Keith Negus, <em>Popular Music in Theory: An Introduction</em> (Middletown: Wesleyan University Press, 1997), p. 4. This definition encompasses how we engage with music in our everyday lives much more usefully than perhaps the embodied act of ‘listening’, or more commercially focused ideas of ‘consumption’ could. This is because music is not just something we hear, or buy; it is also something we talk about, think about, or otherwise use in a variety of ways.

The texts collected by Harkive represent snapshots of different individuals’ engagement with music, and each (to varying degrees) contains descriptions of respondents’ use of various technologies, or the locations and everyday situations involved when engaged in music reception activity. Some stories are inspired by memories, others detail engagement with technologies, and many show how deeply experiences with music and technology are woven into the rhythms and routines of everyday life.

Before proceeding to how I analysed those texts, I should like to provide a little more context for my research. This context is crucial, because it was engaging with the broader issues of debate around contemporary popular music reception, and in particular the role of digital, data, and internet technologies within that, that ultimately informed the methodological approach I took.

Research context

Over the last two decades digital, data, and internet technologies have emerged as important and influential factors in how popular music is produced, distributed and consumed. These technologies, allied to practices of data collection and computational analysis, now play a significant role both in how audiences engage with music, and how those audiences are understood. A key point here is that popular music audiences are now highly individualised, and defined according to a growing number of new categorical variables. At the same time, however, audiences are also understood through the large-scale agglomeration of data points. An example here would be streaming services such as Spotify, which provide access to music through an interface that facilitates the capture, analysis and use of data about the daily activity of millions of people. We may also wish to consider social media platforms, where people discuss and share music, or search engines and online retailers, all of which gather data about users and derive forms of knowledge from that which is then deployed according to what Hartmann et al. call Data-Derived Business Models (DDBMs) 21[21] Philipp Max Hartmann, Mohamed Zaki, Niels Feldmann and Andy Neely, ‘Big data for big business? A taxonomy of data-driven business models used by start-up firms. A Taxonomy of Data-Driven Business Models Used by Start-Up Firms’, University of Cambridge, available at <a href="https://cambridgeservicealliance.eng.cam.ac.uk/news/March2014Paper">https://cambridgeservicealliance.eng.cam.ac.uk/news/March2014Paper,</a> accessed 8 February 2019. – that is, models relying on data as a key resource.

For popular music scholars these are intriguing developments, but studying these new environments is difficult. This is because the systems of data collection and analysis that facilitate them are technologically complex, subject to rapid change, and are often hidden behind commercial and legal firewalls. 22[22] Mike Ananny, ‘Toward an Ethics of Algorithms Convening, Observation, Probability, and Timeliness,’ <em>Science, Technology & Human Values</em>, 2015, 0162243915606523. At the same time, however, the use of online technologies by many people during the course of their everyday lives is providing scholars with new opportunities and methods for undertaking research in the humanities. This in turn is leading to questions about the role of the researcher, and – in the case of popular music studies – how we as scholars may take into account the new technologies and practices that have so changed the field. Of particular interest to me are automated recommender systems, the manner in which digital interfaces foreground (or not) content to audiences, and the new ways in which audiences are conceived of and organised.

Given the growing importance of streaming services, social media platforms, search engines, and so on, within the field, popular music scholars wishing to understand contemporary conditions of music reception are faced with the problem of exploring the consequences of systems that they presently lack sufficient access to, or else the technical knowledge and skills required to fully understand.23[23] Danah Boyd and Kate Crawford, ‘Critical Questions for Big Data: Provocations for a Cultural, Technological, and Scholarly Phenomenon,’ <em>Information, Communication & Society</em> 15, no. 5 (2012), pp. 662–79. Although in the case of streaming services, for example, recent work by Hagen,24[24] Anja Nylund Hagen, ‘The Playlist Experience: Personal Playlists in Music Streaming Services,’ <em>Popular Music and Society</em> 38, no. 5 (2015), pp. 625–645. Nowak, 25[25] Raphaël Nowak, ‘Investigating the Interactions between Individuals and Music Technologies within Contemporary Modes of Music Consumption,’ <em>First Monday</em> 19, no. 10 (2014). Prey, 26[26] Robert Prey, ‘Henri Lefebvre and the Production of Music Streaming Spaces,’ <em>Sociologica</em> 9, no. 3 (2015), pp. 1–22.  and Webster et al. 27[27] Jack Webster et al., ‘Towards a Theoretical Approach for Analysing Music Recommender Systems as Sociotechnical Cultural Intermediaries,’ in <em>Proceedings of the 8th ACM Conference on Web Science</em> (ACM, 2016), pp. 137–145. has made progress in helping to develop our understanding, a wider question for popular music scholars is how such an inquiry into these recently emerged systems may be usefully undertaken. Through The Harkive Project, and via the methods I have developed, my intention has been to see if I could make a contribution to that wider question by discovering a little more about the new conditions of everyday music reception.

Towards a method

In terms of the practicalities of my doctoral work, the size, variety and complexity of the data I had collected through Harkive immediately presented two interrelated methodological and intellectual problems:

  • How could I derive useful information and insight from the large collection of unstructured texts I had gathered?
  • How could I do that in such a way that said something useful and interesting about contemporary popular music reception?

In attempting to deal with those questions, I decided that a potentially productive route would be to subject the Harkive data to similar computational analysis processes to those used by commercial organisations seeking to understand the way people engage with popular music. What I mean here is the idea that activities such as listening through streaming services, Googling your new favourite artist, or discussing music with friends on social media – in other words, activities that would fall under the definition of ‘music reception’ – now often take place within environments where, as Bernhard Rieder describes, data capture, analysis and output are integrated. 28[28] Bernhard Rieder, ‘Big Data and the Paradox of Diversity’. <em>Digital Culture & Society</em>, 2(2), pp. 39-54.

Because of this, music reception activities now create data points that can be aggregated and analysed in order to produce a form of knowledge that in turn informs interface design, or the foregrounding of certain content, which ultimately impacts upon the experiences we may have. We can consider here, for example, automated recommendation and curated playlists offered by streaming services, or product recommendations positioned within the interfaces of online retailers and social media platforms. Through analysing the Harkive texts in a similar manner, and alongside discovering what respondents were saying about their music reception, I wanted to explore the processes involved with attempts to represent complex elements of individual real-world experience through the medium of data and computational analysis.

As attractive as this proposed direction for my research was, however, it revealed an immediate problem related to my own research skills. I attempted to define this problem early on in my research journey, in this quote taken from my research notebook:

I am a reasonably tech-savvy media scholar, but I am not a data scientist, or a coder. Yet I am building a PhD research project that hinges on my ability to make sense of my data through computational techniques.

In short, I had backed myself into a practical, methodological and intellectual cul-de-sac.

The process of finding my way out of that cul-de-sac started with a period of trying to get to grips with the technologies and practices involved. Through an intense period of reading, attending conferences, listening to ‘data science’ podcasts, and several months of self-directed learning in the R programming language, I slowly got to grips with the practicalities of how data and computational techniques are used in commercial settings and academic research. A key realisation, and indeed a consideration for the purposes of the remainder of this article also, is that the texts gathered by Harkive were in a digital format and were thus reducible to data points that could be counted, analysed, and otherwise computationally processed at scale. Stripping away the unique, individual detail contained within each response, the ‘raw material’ I had to work with could be understood as data. My research project was now, concurrently, a philosophical exploration of how data-derived ‘knowledge’ is created and a data science ‘problem’ is to be solved.

Using a number of automated collection methods, 29[29] For a detailed breakdown of this process, see the instructional overview provided on The Harkive project website: <a href="http://harkive.org/datcolzap" class="broken_link">http://harkive.org/datcolzap</a> . Harkive data was subsequently gathered into a single database organised according to the principles of tidy data, 30[30] Hadley Wickham, ‘Tidy Data,’ <em>Journal of Statistical Software</em> 59, no. 10 (2014), pp. 1–23. which made it ready for computational analysis at the point it was collected. The dataset contained text-based submissions and quantitative survey responses, along with metadata gathered during the collection processes – including time/date stamps, and detail on which platforms each text was collected from – and additional variables generated through the use of a series of unsupervised machine learning algorithms, including topic modelling, which is described in more detail below. This meant that the data about music reception activities available to me could be understood and analysed in a number of different ways, ranging from the close readings of texts more usually associated with humanities research, through to the clustering, visualisation and analysis of abstractions generated through computational/algorithmic processes that rendered the original texts as data. The method also allowed for analyses that combined these approaches.

All of which is to say that what I ended up with was an experimental approach that conceived of Harkive as both a ‘space’ in which people could reflect upon their engagement with music, and simultaneously a ‘place’ able to replicate many of the commercial practices related to data collection and processing. Through this, I sought to critically engage with the growing role of data-related technologies associated with music reception, whilst simultaneously exploring the use of those techniques in popular music studies research. An intriguing sub-question that emerged from this methodological development was to attempt to discover what patterns, correlations and other potentially interesting insights could be derived through the use of techniques that are largely guided by their own internal mathematical logics, and less by the human researcher. In the next sections I will walk through one of the ways I explored this question.

LDA topic modelling – overview

One unsupervised algorithmic technique I employed was topic modelling, which David Blei 31[31] David M. Blei, ‘Topic Modeling and Digital Humanities,’ <em>Journal of Digital Humanities</em> 2, no. 1 (2012), pp. 8–11. defines as a process that:

provides a suite of algorithms to discover hidden thematic structure in large collections of texts. The results of topic modelling algorithms can be used to summarize, visualize, explore, and theorize about a corpus.32[32] Blei’s article appears online in the <em>Journal of Digital Humanities</em>, and as such no page numbers are attributed to his quotes. The full article is available here: <a href="http://journalofdigitalhumanities.org/2-1/topic-modeling-and-digital-humanities-by-david-m-blei/">http://journalofdigitalhumanities.org/2-1/topic-modeling-and-digital-humanities-by-david-m-blei/</a>

Topics can better be understood as recurring data points (in this case, words) across a larger dataset (a corpus of text documents). The model, meanwhile, is a mathematical representation of the extent to which each individual entry in a dataset – that is the documents within a given corpus – contains data points – that is topics/words. Applying this to the case of my own research and the Harkive texts, the immediate potential in a process of this kind was that the larger a collection of documents is, the more difficult and labour intensive it becomes to manually explore, encode and reveal common themes within it. Beyond simply saving time and effort, however, a further potential advantage lay in the possibility that there may be themes or topics within the dataset that were not immediately apparent. In other words, these may be hidden or otherwise made ‘latent’ by the complexity and scale of the corpus. The broad rationale behind topic modelling is that latent themes in text corpora may be revealed by mathematical processing.

I employed the most commonly used approach in automated topic modelling, Latent Dirichlet Allocation (LDA), which was originally developed in 2003 by Blei and colleagues at Berkley. Blei has since argued that automated modelling of this kind can help humanities scholars ‘build a statistical lens that encodes…specific knowledge, theories, and assumptions about texts’. 33[33] David M. Blei, Andrew Y. Ng, and Michael I. Jordan, ‘Latent Dirichlet Allocation,’ <em>Journal of Machine Learning Research</em> 3, no. Jan (2003), pp. 993–1022. Blei reveals that LDA in particular can be understood as being based on two assumptions:

  • There is a finite number of patterns of words, or groups of terms, that occur together within a corpus.
  • Each document within a corpus exhibits these to a varying degree.

Although the documents and words are observable to a manual reading, the thematic structure – in other words, the topics – may be hidden, and will be more likely to be hidden as the scale and complexity of a corpus increases.

LDA infers these hidden structures based on what can be computationally processed (that is, by counting the frequency with which unique words occur across documents), and represents these in terms of the probabilistic likelihood that a document belongs to a given topic. It was this process and rationale that was applied to the Harkive dataset from the years 2013–2016 inclusive.

LDA Topic modelling and Harkive texts

Using the topicmodels package with the R software, the LDA process described above revealed the following words associated with five topics, organised here according to frequency, with the top 20 words associated with each topic shown in Figure 1 below. The LDA process of course had no ‘knowledge’ about the contents or meaning of the document corpus and had processed it purely according to the statistical probability of words appearing in documents. Nevertheless the initial results were interesting, and I was able to interpret the topics as being relatively distinct. The appearance, for instance, of words such as morning, home, office, train, commute, and so on, were interpreted as being related to ideas of ‘Time and Place’. Another topic containing words such as love, play, sing, hear, summer and favourite was interpreted as being more closely associated with ‘Emotions and Experience’. There were other topics related to ‘Formats and Methods’, another more generally about ‘Listening’, and finally one that appeared to relate to The Harkive Project itself, with words such as post, tweet, project, blog, and write.

Top twenty frequently occurring words in each LDA topic
Figure 1: Top 20 frequently occurring words in each LDA topic. Colour-coded according to research interpretation, with words interpreted as being most closely aligned to the interpreted topics colour-coded.

To explore these initial results further it was also possible to visualise them alongside other variables, including the results of other unsupervised analyses. In Figure 2, for instance, we can see how topic allocation plays out according to the various channels by which texts were gathered, suggesting that texts gathered from Facebook, email and Flickr contained a higher proportion of texts allocated to the ‘Emotions and Experience’ topic by LDA processing.

LDA topic allocation - Graph
Figure 2: Proportion of texts gathered via each automated collection method according to LDA topic allocation

Figure 3 visualises the LDA results alongside another unsupervised algorithmic analysis, sentiment analysis, and suggested a high concentration of texts in the ‘Time and Place’ topic clustered around a neutral sentiment, while ‘Emotions and Experience’ texts appeared to exhibit a wider spread of positive and negative scores. Figure 4, meanwhile, visualises some frequent words revealed by the LDA process in terms of trends across the lifetime of the project. The rise in mentions of Spotify and vinyl since 2013, along with the downward trend in mentions of iTunes and downloads, appears to tally somewhat with what appears to be happening in popular music consumption more widely.34[34] See, for instance, IFPI reports on the revenues derived from recorded music: <a href="http://www.ifpi.org/news/IFPI-GLOBAL-MUSIC-REPORT-2018">http://www.ifpi.org/news/IFPI-GLOBAL-MUSIC-REPORT-2018</a>

Scatterplot graph
Figure 3: Scatterplot demonstrating relationship between Sentiment Analysis scores and Standard Deviation in Topic Allocation, coloured according to LDA Topic Allocation.
Percentage Chart
Figure 4: Percentage of texts containing keywords across each of the years 2013–2016, inclusive.

Although these initial results and exploratory visualisations are potentially useful and may lead to further questions, it was still necessary to delve a little deeper, both in terms of finding interesting things about music reception, but also in terms of exploring how the process of analysing data in this way produces forms of knowledge. An example of a potentially useful route towards this can be seen if we go back to the LDA topic allocation outlined in Figure 1 and look specifically at words relating to the ‘Formats and Methods’ topic. We may notice, for instance, that the word vinyl appears instead amongst the ‘Emotions and Experience’ topic, and that words related to mobile-based digital listening formats and technologies, such as ipod, shuffle and headphones, appear in the ‘Time and Place’ topic. An interesting initial observation is that these allocations seems to perhaps fit with some more widely held notions of those two modes of listening as having distinct characteristics: vinyl is often associated with a more ‘warm’, ‘authentic’ and ‘real’ experience of listening; digital listening by comparison is seen as cold, distracted, and functional. This may suggest that the texts gathered by Harkive perhaps contain descriptions that repeat similar ideas, and moreover that the LDA process has been efficient in revealing this. But is that indeed the case?

Topic scores
Figure 5: LDA Topic Allocation scores for the first 10 documents in the corpus. Each row produces 5 values, each associated with a topic, that are divisions of a total score of 1.

In fact, a closer look at the numbers behind such an observation suggests that the differences between documents, and thus their alignment with discrete topics, were perhaps less stark than the corpus-wide overview suggested. The topic modelling process is based on the assumption that documents within a corpus exhibit relationships to all topics in varying degrees, and the figures in Figure 6 show those relationships in terms of a total score that is equal to 1. We may note that there are some very marginal differences between topic allocations, and so corpus level observations – in this case about digital and analogue listening methods – need to be augmented by a further, close reading before any claims could be reasonably made. Do the assumptions we carry about the technologies of vinyl records and the iPod, for instance, that appear to have been foregrounded and validated by the results of the computational reading facilitated by the LDA process, carry over into a close, manual reading of the texts concerned? In other words, how far does Blei’s ‘statistical lens’ take us in terms of theorising about a corpus? By looking more closely at texts containing mentions of vinyl, we are able to explore this further.

Case study: music reception and vinyl

Isolating from the corpus those texts containing the word vinyl returned n=139 entries, which represented 1.83% of the total corpus. From the following visualisations we can immediately observe two things. Figure 7 reveals that not only are stories mentioning vinyl present in all topics, but that a similar number (n=40) appear in the ‘Time and Place’ topic to those appearing in the ‘Emotions and Experience’ topic (n=33). Almost immediately these results appear to challenge the conclusions suggested by the corpus-wide analysis discussed in the previous section. We can see that vinyl is discussed in many other topics than the one it was allocated to by the LDA process, and which has been interpreted as related to ideas of the emotional and experiential. To what extent, then, do texts containing the word vinyl allocated to particular topics exhibit the characteristics our interpretation has assigned to those topics? A closer reading of the 139 texts containing the word vinyl in terms of their allocation to different LDA topics reveals some interesting results.

Bar chart
Figure 6: LDA topic allocation of texts containing the word vinyl.

Of the (n=40) vinyl stories contained within the ‘Time and Place’ topic, 20% (n=8) contain only information about what the respondent had played. These were texts where the respondent mentions only the name of an artist or record they were listening to at the time, and have mentioned that they were using vinyl, but have not provided any additional context. Of the remaining 32 texts, 69% (n=22) explicitly reference listening whilst working, or being in domestic spaces, and in the examples below we can see vinyl records being used in mundane, everyday situations, including ironing school uniforms and hanging out washing. Considering first of all the topic allocation of ‘Time and Place’, the activities accompanying vinyl listening here are emblematic of what we may expect, yet appear to challenge the conclusion suggested by the corpus-level overview:

Quick coffee before next set of jobs / chores. Ornette Coleman – Twins, vinyl (#295) 35[35] All quotes and extracts from Harkive stories presented in this and subsequent chapters will be identified only by their unique story number allocated by the collection process outlined above.

Decided the Marvin’s too uptempo for the heat. Playing ‘One On One’ by Bob James & Earl Klugh on vinyl LP, hanging out the washing (#7040)

Working from home today so will mainly be listening to vinyl (#5764)

Ironing school uniforms ‘Toussaint’ by Allen Toussaint on vinyl and what a cracker this is (#2377)

First up for @harkive 2014, Beirut, The Rip Tide on vinyl while my daughter has her breakfast (#6056)

#harkive Whilst kids getting ready for bed, had bits of Armand Van Helden ‘Killing Puritans’ and Faith No More ‘The Real Thing’ from iTunes, then a bit of ‘American Supreme’ by Suicide on vinyl to bring them right down….(#1125)

In the ‘Emotions and Experience’ topic, meanwhile, we perhaps begin to see support for the conclusion suggested by the corpus-level analysis. Although, as in the ‘Time and Place’ topic, some texts (33% (n=11)) contain only information about what has been played and provide no further context, of the remaining 22 texts 45% (n=10) make specific reference to the aesthetics and physicality of the ‘spinning’ vinyl record as an object. These features appear to play a central role in its descriptions of its use, as evidenced by the examples below:

I really want to get this Bosconi Stallions set on vinyl as it comes in a box that looks like this [photo attached] (#3180)

It’s my Vertigo copy of Autobahn, I love this sleeve almost as much as the record (#330)

On to vinyl (must remember to take it off at the end, can’t risk warping!) (#7643)

I listen to music in all formats, CD, Cassette, MP3 but my favourite is still vinyl. I just love the ceremony of playing a record (#4159)

I’m spending Harkive Day at home with a pile of records to listen to…I love rooting through boxes of old records looking for the next addition to my..collection; it’s a great way of discovering new old music and I’ve gained loads of favourite artists this way (#5126)

Looking forward to getting home and spinning some new charity shop vinyl purchases for pleasure and #harkive (#3111)

A further 27% (n=6) of the texts made explicit reference to vinyl in terms of memory (‘I’d forgotten how good this sounded!’). In the first example below, a longer-form text about playing a record, the respondent recalls going to a Bruce Springsteen show. Meanwhile, 50% (n=11) of the texts in this topic also discussed listening to vinyl in other experiential terms, referencing physical and emotional reactions to the music they heard on vinyl:

I remember being lent Born To Run, The River, and Greetings From Asbury Park by our very musically wise youth leader with a ‘you MUST listen to these’, and I did, and loved them too. But for some reason I stopped listening to Springsteen at all a few years after that, my vinyl got put away in a cupboard. (#2155)

Mrs R out again so loud vinyl time. This one really shakes the walls (#1364)

Darn That Dream’ from ‘Undercurrent’ by Bill Evans & Jim Hall on vinyl. Music that doesn’t break a sweat whilst the rest of us do (#7039)

Little Richard & His Band Pt 2 on 7’ #vinyl (London 1957). Imagine hearing Tutti Frutti for the 1st time. (#71)

In the ‘Formats and Methods’ topic cluster, which we may recall contained almost all the other common methods through which people listen (that is, radio, Spotify, iTunes, and so on), we find 22 texts, 9% (n=2) containing only information about what has been played and provide no further context. Of the remaining 20 texts, however, 75% (n=15) discuss vinyl within the context of other technologies, services and formats. Here we can see evidence of the type of fractured and heterogeneous listening suggested by Nowak, 36[36] Raphaël Nowak, ‘Investigating the Interactions between Individuals and Music Technologies within Contemporary Modes of Music Consumption,’ <em>First Monday</em> 19, no. 10 (2014). where meaning is derived not so much from the properties, affordances or perceptions of a particular format, but rather from the ‘circuit of practices’ Maguadda 37[37] Paolo Magaudda, ‘When Materiality ‘bites Back’: Digital Music Consumption Practices in the Age of Dematerialization,’ <em>Journal of Consumer Culture</em> 11, no. 1 (2011), pp. 15–36. describes that together combine to constitute cultural practices around the reception of music. Vinyl listening is variously informed by the use of streaming services, or else discussed in terms of the download codes that now accompany new vinyl releases:

I guess I make most of my musical discoveries in the evenings and then do further investigation/research during the day via Spotify (before deciding to either download the album from eMusic or buy on CD/vinyl) (#5822)

Finally streaming ‘Electric’ by Pet Shop Boys after ten annoying minutes of having to download Pandora on a new phone and resetting my password. If it’s good I’m pre ordering the vinyl. 11:34 Well that was fantastic. Aside from the ads (#162)

This morning was something from Wolves In The Throne Room, I got their new album on LP from my local indie vinyl place last week and the handy digital download means the songs live in all my devices immediately (#5560)

Taken together this brief analysis of the small number of texts containing the word vinyl demonstrates that this particular format can be seen as being described by respondents in many other ways than the initial corpus-wide computational analysis and subsequent clustering and visualisation suggested. As well as evidence of vinyl providing the types of visceral, aesthetic and emotional experiences that Barthamski and Woodward 38[38] Dominik Bartmanski and Ian Woodward, ‘Vinyl: The Analogue Record in the Digital Age’ (London: Bloomsbury, 2014). suggest are defining factors of vinyl use, we can also see it being used as a background accompaniment to more mundane, everyday activities – something perhaps more commonly associated with digital technologies. 39[39] See, for example, Jonathan Sterne, ‘The mp3 as cultural artifact’, <em>New media & Society</em>, 8(5), 2006, pp. 825–842. We also see vinyl being used as part of more complex listener practices that make use of different formats and technologies as part of individualised cultural practices. An interesting thing to observe also is the apparent absence of any qualifying statements regarding the ‘better’ or ‘more authentic’ qualities of vinyl listening in comparison to other formats and technologies. In the main we see the use of vinyl records as being narrated by respondents as part of a complex, wider landscape of music reception in a variety of everyday contexts – including in commuting, working, social and other situations. These everyday situations are what Felski calls the ‘mundane activities that frame our forays into more esoteric or exotic worlds’, 40[40] Rita Felski, ‘The invention of everyday life’. <em>New formations</em>, (39), pp. 13–31. and here – recalling again Maguagga – we can see that vinyl is but one way the use of available technologies provide the means through which these forays occur. Perhaps more pertinently, this section has also shown that computational analyses, if used uncritically and unreflexively, could be used to generate results that may help reinforce or otherwise appear to support assumptions we may have – in this case, around the manner in which vinyl is used – when in actuality the detail beneath the abstractions reveals that in individual cases those assumptions are problematic. A key reflexive observation enabled by this analysis is that computational processes have both numerous benefits and limitations when used in humanities research and with cultural texts. The responsibility for ascertaining the difference between these two extremes falls to the critical researcher, who is required to make careful decisions at each stage of the research process, and particularly when it comes to interpreting the results of computational analyses.

Reflection and discussion

In reflecting upon the issues and questions that have informed the development of my method, I must consider first of all how as a researcher I initially lacked the technical skills required to collect, prepare and analyse data in the manner I had identified as being of potential use. As such my project became as much about how to conceive of new methods for studying the reception of music as it did about studying music reception.

The approach I arrived at drew upon similar methods to those used in the commercial environments of popular music, and to methods associated with the computational turn in humanities research. 41[41] David M. Berry, ‘The Computational Turn: Thinking about the Digital Humanities,’ <em>Culture Machine</em> 12, no. 0 (2011), p. 2. Data collection processes and computational techniques have been shown in the analysis above to be in equal parts technically efficient, potentially useful in question formation, but also inherently reductive and in a manner which often prevents them from capturing and accurately reflecting complex cultural practices. In particular, text-based, qualitative data is a difficult form of data to process using computational methods and can lead to results that are problematic. I must recognise also, however, the extent to which the different modes of analysis afforded by my chosen method have enabled me to arrive at different forms of insight (and further questions) that may not have arisen through methods usually associated with the humanities alone. In other words, the observations derived from such an approach speak as much to the approach itself as they do to their application.

I still do not consider myself a coder, or a data scientist, and have attempted to utilise some complex mathematical processes from an under-privileged viewpoint. This is perhaps representative of a wider problem in the humanities when it comes to work of this kind, where as scholars we are attracted to the affordances of large datasets and computational techniques through their increasing availability and falling barriers to entry, but are simultaneously ill equipped to adequately explain and explore those methods of analysis.

By publishing regular notes on The Harkive Project website, or through the creation of interfaces such as the recently created data explorer – a resource providing both interactive access to the Harkive data and analysis and also raw code and instructional videos that enable replication of my work – I am attempting to reveal and reflect upon what Sandvig and Hargittai call the messy benchwork 42[42] Christian Sandvig and Eszter Hargittai, ‘How to Think about Digital Research,’ <em>Digital Research Confidential: The Secrets of Studying Behavior Online </em>(Cambridge, MA: MIT Press, 2015), p. 1. involved when attempting to put such techniques to use. They argue that – apart from in ethnographic work – there is very little notion of ‘bench science’ in the humanities and social sciences, but that there should be. Their point is that the ‘workaday’ practices of our research processes need to be highlighted, particularly in areas of work that look at digital media and the internet, because these are producing the ‘new methods, new opportunities, and new challenges for understanding human behavior and society.’ As the authors state, the desired outcome is a space where ‘researchers can reveal the messy details of what they are actually doing, aiming towards mutual reflection, creativity, and learning that advances the state of the art’.43[43] Christian Sandvig and Eszter Hargittai, ‘How to Think about Digital Research,’ <em>Digital Research Confidential: The Secrets of Studying Behavior Online </em>(Cambridge, MA: MIT Press, 2015), p. 5. It is my hope that my work around The Harkive Project may make a small contribution in this regard.

Conclusion

The analysis in this chapter will, I hope, have helped raise new questions for the reader on a general level about how we may approach the complexity of contemporary music reception and – specifically – how we may begin to critically engage with the data-derived technologies and practices that now play a key role in those music reception activities. My aim has been to provide both an argument for and perhaps even a suggested route towards a more practical engagement with data, digital, and internet technologies. The intention has been to suggest new means by which scholars may be prompted to think about the efficacy of data systems when they are applied to popular music, to challenge numerous assumptions around what a data point can and does represent, and to consider ways in which we may formulate new ways of working that are able to critically engage with digital, internet, and data technologies through practical work that attempts to understand their operations, benefits, and consequences.

In terms of the practicalities of method that may underpin such an approach, in reflecting upon the process of developing and performing my research, I can offer in the first instance that the process of learning involved with attempting work of this kind is hard – particularly if the researcher is approaching it from scratch, as I did – but, equally, that it is possible to arrive at a point where such work can be undertaken. I have shown also that when approaching data-related research projects, thinking about collection, organisation and analyses as one interrelated process is extremely useful, and probably essential.

More specifically, unsupervised machine-learning algorithms such as topic modelling can efficiently help reveal trends and patterns within a text-based corpus. However, although the results on the surface appear unequivocal, a closer examination of the numbers behind any claims related to those results reveals problems, and further questions. However, exploring both the results and the process nevertheless points towards potentially fruitful lines of enquiry that can be facilitated by further computational techniques, such as the automated extraction of specific elements based on results, keywords, and other variables, which is particularly useful with large datasets. Such processes, as I have shown, can simultaneously assist with question formation and – on a practical level – with the foregrounding of texts in large corpora. As I hope to have shown, however, it was only when considered alongside manual, close readings of texts – facilitated in part by automated process – that the results of computational processing were fully understood. As such computational techniques should be used to augment, rather than replace, close readings of texts.

As I continue to develop my own analyses into popular music reception, learning from one coding error after another through experimenting with practice and method, the limitations and affordances of working in this way are slowly revealed in the process of writing my notes, in the detail of the painfully slow, step-by-step benchwork. It is my hope that other scholars may find the resources I have made available on The Harkive Project website, and through interfaces such as the 2013–17 Data Explorer, of use. They may also find that work of this kind can be replicated, built upon, and may lead to the creation of new questions, collaborations, and projects as together we endeavour to understand the role of digital, data, and internet technologies in the field of popular music studies.

Select bibliography

Ananny, Mike. ‘Toward an Ethics of Algorithms Convening, Observation, Probability, and Timeliness,’ Science, Technology & Human Values, 2015, 0162243915606523.

Berry, David M. ‘The Computational Turn: Thinking about the Digital Humanities,’ Culture Machine 12, no. 0, 2011, p. 2.

Blei, David M. ‘Topic Modeling and Digital Humanities,’ Journal of Digital Humanities 2, no. 1, 2012, pp. 8–11.

Boyd, Danah and Crawford, Kate. ‘Critical Questions for Big Data: Provocations for a Cultural, Technological, and Scholarly Phenomenon,’ Information, Communication & Society 15, no. 5, 2012, pp. 662–679.

Felski, Rita. ‘The invention of everyday life’. New Formations (39), 1992, pp. 13–31.

Hamilton, Craig. ‘The Harkive Data Explorer v1.0’, Web application / Research Database / Scholarly Resource, http://www.harkive.org/data1317, accessed 12 February 2019.

Negus, Keith. Popular Music in Theory: An Introduction. Middletown: Wesleyan University Press, 1997.

Nowak, Raphaël. ‘Investigating the Interactions between Individuals and Music Technologies within Contemporary Modes of Music Consumption,’ First Monday 19, no. 10, 2014.

Prey, Robert. ‘Henri Lefebvre and the Production of Music Streaming Spaces,’ Sociologica 9, no. 3, 2015, pp. 1–22.

Sandvig, Christian and Hargittai, Eszter. ‘How to Think about Digital Research,’ Digital Research Confidential: The Secrets of Studying Behavior Online, 2015, p. 1.

Webster, Jack, Gibbins, Nicholas, Halford, Susan and Hracs, Brian J. ‘Towards a Theoretical Approach for Analysing Music Recommender Systems as Sociotechnical Cultural Intermediaries,’ in Proceedings of the 8th ACM Conference on Web Science, pp. 137–145. ACM, 2016.

Wickham, Hadley. ‘Tidy Data,’ Journal of Statistical Software 59, no. 10, 2014, pp. 1–23.

Please leave a comment or share via social media by clicking on the icons.

View the online publication details 44[44] <em>The Experience of Listening to Music: Methodologies, Identities, Histories</em> has been Open Access funded by the Arts & Humanities Research Council (AHRC), grant AH/J013986/1, https://ledbooks.org/proceedings2019 The collection has been peer reviewed, edited by David Rowland and Helen Barlow, and subsequently prepared for online publication by the Knowledge Media Institute (KMi) of The Open University. Published by: The Open University, Walton Hall, Milton Keynes MK7 6AA.  Copyright © The Open University. First published: July 2019. ISBN: 9781473028647. PDFs displaying some of the content from the online collection are available from <a href="https://ledbooks.org/proceedings2019/getting-the-best-from-this-website/">https://ledbooks.org/proceedings2019/getting-the-best-from-this-website/</a> You can experience the online publication as it was originally designed at <a href="https://ledbooks.org/proceedings2019">https://ledbooks.org/proceedings2019</a> View copyright information relating to the publication here: <a href="https://ledbooks.org/proceedings2019/copyright">https://ledbooks.org/proceedings2019/copyright</a> 


Download: The Harkive Project: popular music reception, digital technologies, and data analysis